PG Soundings
The free-flight forecast inside Windy: wind and thermals, altitude by altitude and hour by hour, with clouds, fronts, thunderstorm risk and the sounding of the place you pick.
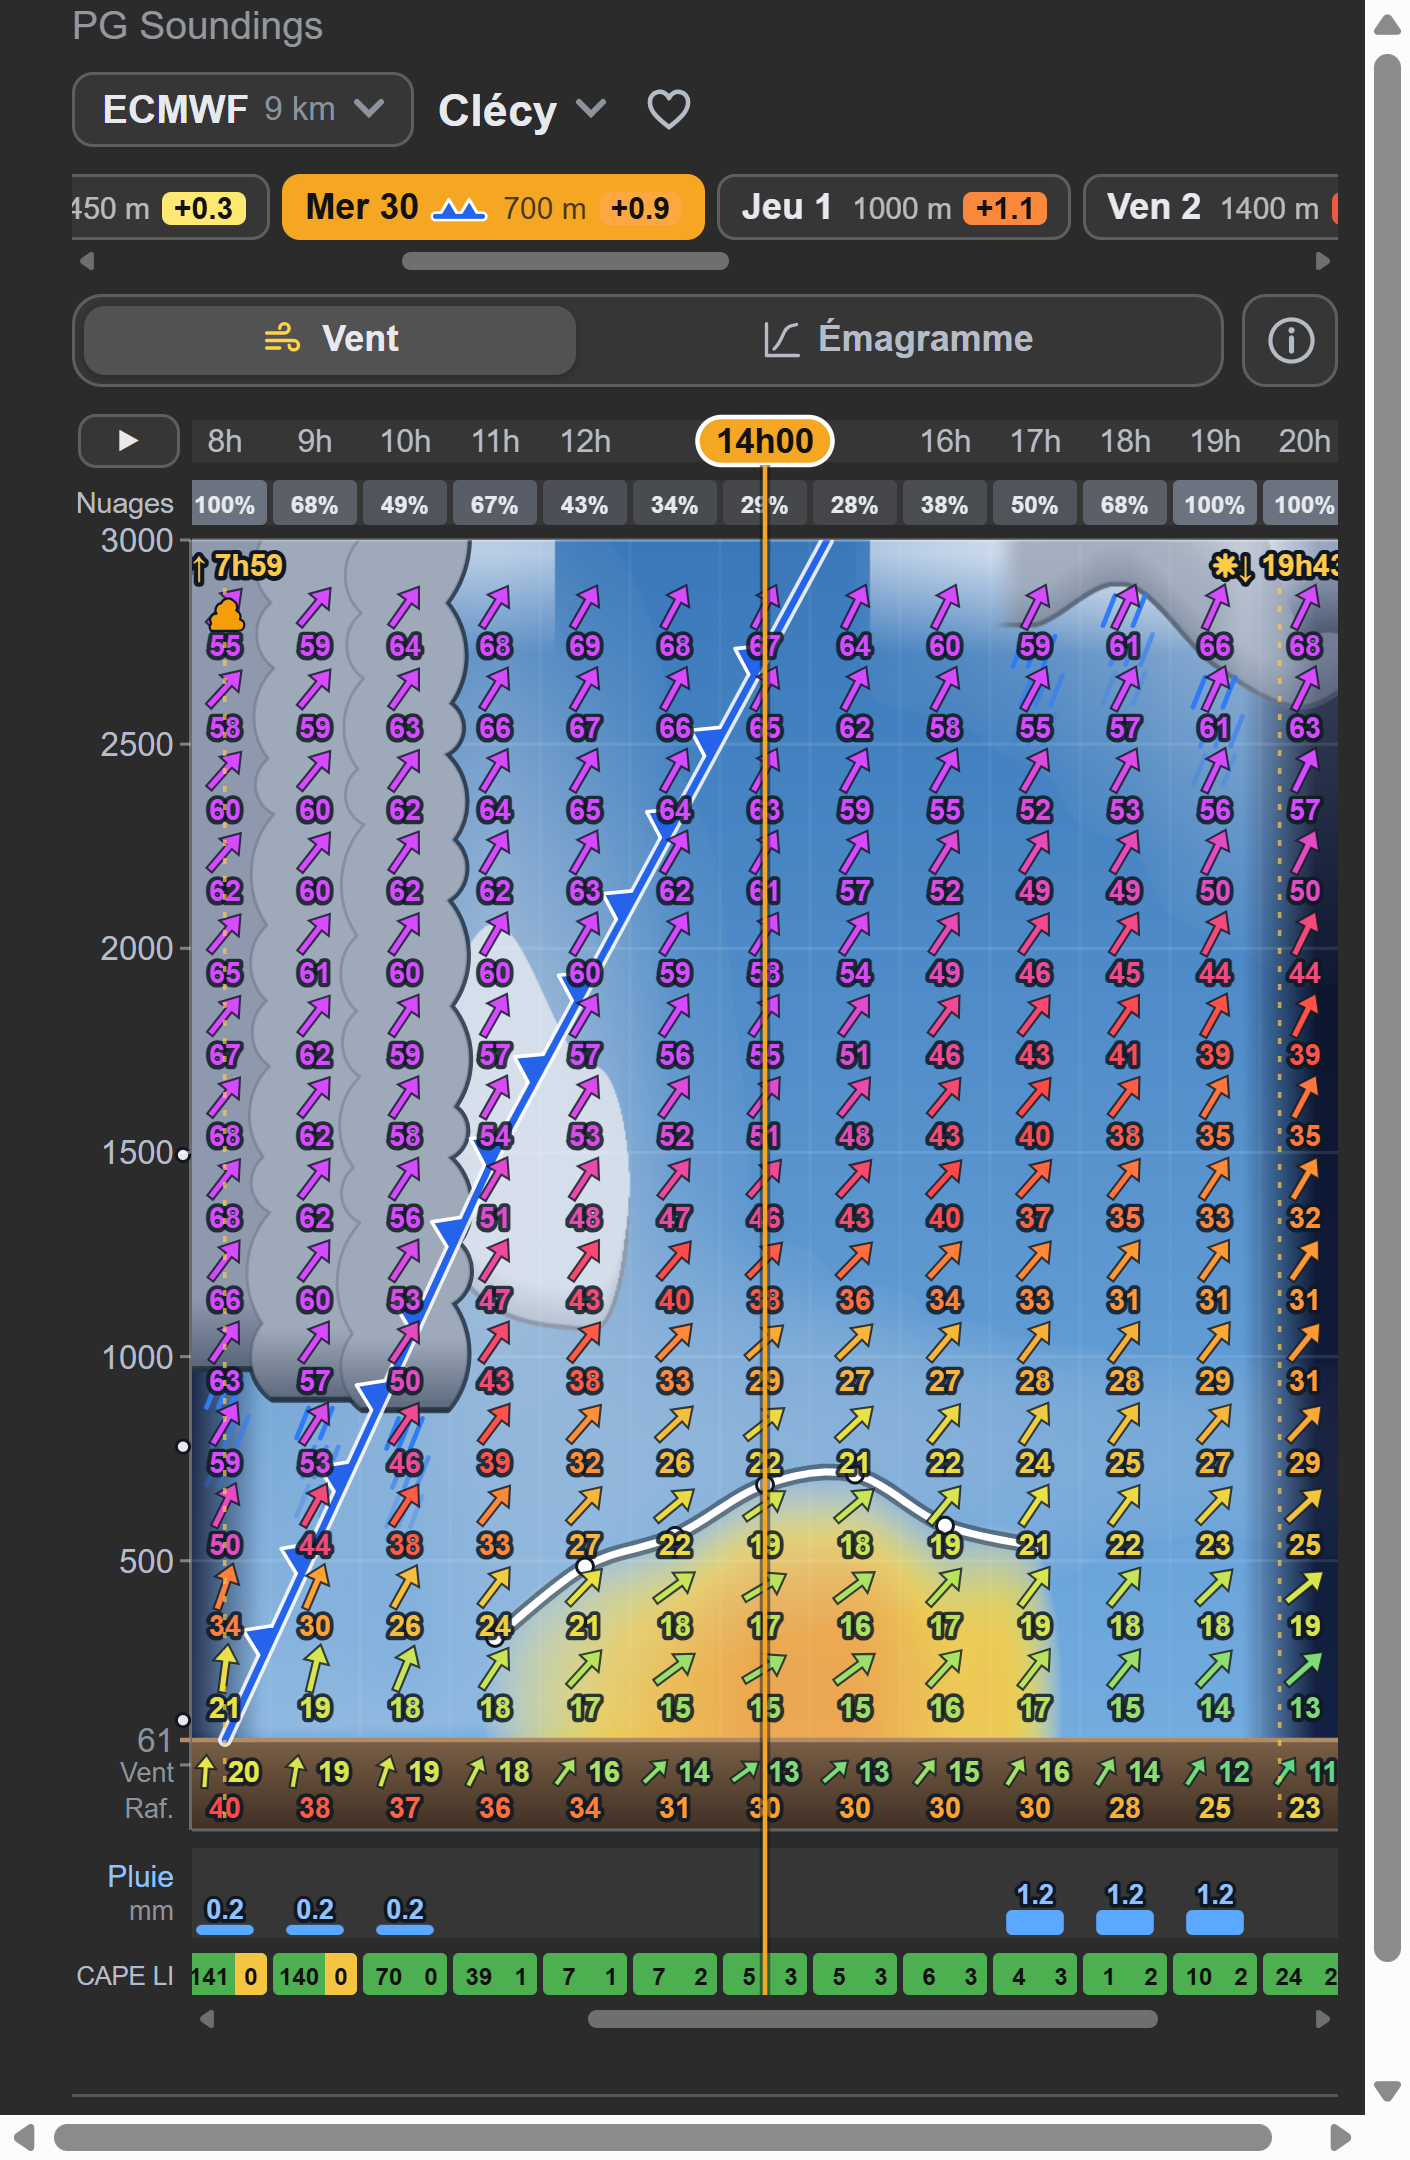
- Wind aloftOne arrow per altitude band and per hour, coloured by speed, with the surface wind and gusts.
- ThermalsThe climb read on the vario, the usable ceiling, the cumulus they build and thermals made choppy by the wind.
- Clouds and rainCumulus, shower clouds, cloud ceiling, sea of clouds, snow line, virga.
- ThunderstormsRisk hour by hour, a warning banner on storm days, a neighbouring storm pushed towards the place, CAPE and LI.
- FrontsCold fronts, warm fronts and occluded fronts drawn on the chart at the hour they pass.
- SoundingSkewed sounding of every hour: temperature curve, dew point, parcel ascent, freezing level.
- Linked to the Windy mapThe hour, altitude, model and place of the plugin follow the map, and the map follows them.
- Seven modelsECMWF, ICON, GFS, ICON-EU, ICON-D2, AROME and UKV, in English or French depending on the language of Windy.
Install the plugin
- Open windy.com/plugins, signed in to your Windy account.
- Choose “Load plugin directly from URL” and paste this link in place of the text already in the field:
- Click a flying site on the map: the plugin remembers your last place.
The plugin then announces new versions itself. It works on a computer as well as on a phone.
What’s new
Version 1.13.07 October 2026
The way clouds are drawn changes, not the way they are computed: bases, tops, rain and hours are the same as before, in the tooltip and on the chart.
Added
- Chart tooltip, by touch: a cross closes it.
Changed
- "Wind & thermals" chart: the "Rain" strip is only shown if it rains at one of the hours shown, and the "CAPE LI" strip is not shown when CAPE and LI stay green at every hour. The rain of the hour remains in the tooltip.
- Shorter chart tooltip. The pointed altitude is now written only in the title: in each group, the value at that altitude comes first, underlined. The wind is on its title line, the vario at the pointed altitude and the max vario on one line, the three temperatures (pointed altitude, ground, freezing level) on one line, the cloud cover at the pointed altitude and its total on one line. The speed of the rising air, next to the max vario, is no longer written there. The tooltip is slightly wider.
- Chart tooltip: the ceiling is named "Usable ceiling".
- "New version" banner: it says to paste the link in place of the text already in Windy's field ("https://windy-plugins.com/"). Pasted after that text, the link started twice and Windy rejected it.
- Chart tooltip: CAPE and LI are no longer in it. They are read in the "CAPE LI" strip and in the "Sounding" tab.
- Shower clouds at consecutive hours, or at hours separated by a single hour without showers: a single mass, with a single outline, instead of one tower per hour stuck to its neighbours. Its base and top pass through those of each shower hour, with no stair steps or bulges between two hours.
- Cloud ceiling: it is no longer drawn as a sheet, but by the dark line of its base, under the shadow of the cloud's underside, on the veil of the model's clouds, which already shows the layer. The sheet, lighter than the veil and drawn up to its top, read like a cloud inside a cloud; where the layer did not last from one hour to the next, its edges made towers and hills, and the thick layer of a rainy day became a meaningless grey shape. The top of a sea of clouds is still underlined in white. The lumpy top of a layer in clumps and the thin band of an altocumulus are no longer drawn: the type of the layer is read in the tooltip. The line fades when the layer does not last until the neighbouring hour, and is not drawn where a shower cloud goes through the layer at the same hour: it is the same cloud.
- Veil of the model's clouds: solid from 75% cloud cover, instead of 100%, and lighter below 40%. Between hours at 80 and 100%, the veil made vertical bands; at 75%, the sky is overcast. And the edge of a veil whose cloud cover hovers around 30% from one hour to the next made bumps, especially at night.
- Cloud ceiling: along a given layer, its base and top are smoothed with the neighbouring hours (three-hour mean), on the chart, in the tooltip and on the sounding. They jumped from one model level to another when the cloud cover hovers around the threshold: the ceiling of a rainy day zigzagged by 500 m from one hour to the next.
- Terrain in cloud: the dashes are no longer drawn on a dense veil, which already shows that the terrain is in cloud. They remain where the veil is light or absent.
- Thermal cumulus: even when spread out, those of two neighbouring hours no longer touch.
- Glow of clouds higher than the chart: it builds up gradually from one hour to the next, with no sharp edge.
Fixed
- "New version" banner: it sometimes announced an intermediate version instead of the latest one, and could keep for hours a version found during a network outage. The latest version is now read on GitHub (latest release) and checked on windy-plugins.com before being announced; with no answer from GitHub, the version-by-version search goes all the way and passes over skipped numbers.
- Light theme, on phones: the cross that closes the panel stayed white, and the band at the top of the panel, between the map and the plugin, stayed dark.
- Dark theme: the drop-down lists of the settings (max altitude, panel size) opened with light grey text on a white background.
Version 1.12.04 October 2026
Added
- Panel size: 70% of the screen can be chosen, in addition to 30, 50 and 60%.
Version 1.11.04 October 2026
Added
- Favourite places: the place name, at the top of the panel, opens the list of favourites of the Windy account; choosing one takes the plugin and the map there. The heart next to the name adds the place shown to the Windy favourites, or removes it. The place shown takes the name of the favourite it sits on.
- Sounding: a blue dot marks the freezing level on the temperature curve, where it crosses the blue isotherm.
Changed
- Panel size: the choice is 30, 50 or 60% of the screen, and 60% as long as nothing is chosen. The panel no longer takes the whole screen on phones, nor its fixed width on desktop: the "Full screen" and "Default" choices are removed.
- On phones and tablets, moving the map no longer changes the place: it changes when you tap the map or choose a favourite.
- On phones, the "PG Soundings" title is hidden and the content starts at the very top of the panel.
- The left and right margins of the panel are thinner: the chart and the sounding are wider, by about thirty pixels on phones.
- The settings at the bottom of the panel (max altitude, 24 h, theme, panel size, sounding options) and the information about the data (site elevation and model ground elevation, nearby ridges, forecast run time) are folded under a "Settings & info" button, which opens them on demand.
- Sounding: the ceiling, the cumulus and the temperature and dew point at the ground are no longer repeated below the sounding, where they are already written. What remains below is the vario, the freezing level, CAPE, LI and the storm risk. On the sounding, the ceiling is also written when it is well below the cumulus base, and a level higher than the frame is written at the top.
Removed
- "Wind & thermals" chart: the "Therm." strip below the chart is removed. The thermal quality of each hour is still given by the tooltip ("Thermals" line).
Version 1.10.04 October 2026
Added
- Panel size of your choice, in the settings at the bottom of the panel: 25, 50 or 75% of the screen. On desktop and tablets, it is the width of the panel, to the right of the map; on phones, its height: the panel stays at the bottom and the map shows above it. The map shifts so that the place stays in the middle of its visible part. The choice is remembered; "Default" (desktop) and "Full screen" (phone) keep the previous size.
Changed
- On phones, the handle at the top of the panel, which lowered it halfway when pulled, is removed: the panel size is only changed with the setting at the bottom of the panel.
- The narrow layout (short tabs, days on one line, sounding values two per line) follows the width of the panel, no longer that of the screen: a panel reduced to 25% of the screen on desktop uses it too.
Fixed
- On desktop, when the chart or the sounding scrolls (narrow panel), the scrollbar sits below the chart instead of covering it: the "CAPE LI" strip and the temperature axis of the sounding stay readable.
Version 1.9.04 October 2026
Front times change. Cold fronts are shown 1 to 6 hours earlier (2 hours in the median), at the hour when the air starts to change; warm fronts up to 6 hours later (2 hours in the median), at the hour when it finishes changing. Both used to be placed at the hour when the air changes fastest.
Changed
- The plugin's place is always marked on the map by its own marker, an orange crosshair, even when Windy's picker is open. The marker sits on the place whose forecast the panel shows: if the picker or another point of the map is elsewhere, the gap is visible.
- On phones, the top of the panel takes less room: the "Wind" and "Sounding" tabs fit on one line, icon and name side by side, and so does each day of the list (name, ceiling and vario in a row, without the words "Ceiling" and "m/s").
- The model selector is smaller.
- Sounding: on hover, the values are written on the curves, next to their dot, instead of the tooltip: temperature, dew point, parcel and sunrise curve. The temperature lapse rate is written below the line, in °C per 100 m (no longer per km), in the colour of its stability.
- Shorter chart tooltip: clouds higher than the chart on the total line, the cloud of the rain or of the showers on the rain line, shortened layer names ("Layer", "Fog"), tighter lines. The ground temperature is given with the model ground elevation ("Ground (466 m)"), without the dew point.
- "Wind & thermals" chart: the "Sky" strip is now called "Clouds".
- "Wind & thermals" chart: the altitude of the map level, the one a click on the chart chooses, is written in orange on the altitude axis, at the end of its dashes, instead of the triangle.
- "Wind & thermals" chart: the hours are written at the top, on the time bar, and no longer below the chart. The orange line of the chosen hour runs all the way down, through the "Therm.", "Rain" and "CAPE LI" strips.
- "Wind & thermals" chart: the glow that signals clouds higher than the chart is more visible. It is taller, lighter, and solid right at the top edge, by day and by night alike.
Removed
- Fronts: the label at the foot of the line ("Warm front 13:00–16:00", "Fast cold front · gusts 55"), the bar that joined the two hours of a model provided every 3 hours, and the notice, at the edge of the chart, of a front during the night or the day before ("← Cold front 22:00"). The line and its symbols remain; the name of the front, its hours and its gusts are read in the tooltip of the hours it crosses, and the front symbol still follows the name of the day it passes.
- Chart tooltip: the surface wind and gusts, already written in the terrain of the chart, and the thermal top.
- Sounding: the thermal top, in the values below the chart. It remains marked on the curve with the "Parcel ascent" option.
- Sounding: the hover tooltip, and with it the pressure, the vario, the wind and the clouds at the pointed altitude. Wind and clouds are read in the columns on the right.
Fixed
- Cold fronts: the line was drawn 2 to 3 hours too late. It was placed at the hour when the air changes fastest, in the middle of the cooling; it is now placed at the hour when the air starts to change, the one when the wind shifts at the ground. The foot of the line, the hour in the tooltip and the symbol in the list of days move earlier by as much (1 to 6 hours depending on the front), and the line passes earlier up to about 1,500 m.
- Warm fronts: the line was drawn 2 to 3 hours too early at the ground, in the middle of the warming. It is now placed at the hour when the air finishes changing, the one when the wind shifts at the ground: the foot of the line, the hour in the tooltip and the symbol in the list of days move later by as much (up to 6 hours depending on the front).
- Cloud ceiling: when the layer weakens, the sheet no longer jumps, for an hour or two, to a shred of cloud at another altitude that never covered half the sky. It stays at the altitude of the layer as long as the layer keeps 40% cloud, then stops.
- Sea of clouds: it is also recognised when the top of the layer falls on a model level. The air "just above" was then read at that level, inside the layer itself.
Version 1.8.03 October 2026
The values shown do not change: ceilings, climb rates, thresholds and front times remain those of 1.7.0. This version adds signals for strong phenomena (fast fronts, wind surges, dust devils, downdraft gusts, nearby storms) and links the plugin's place and altitude to the Windy map.
Added
- Fronts: their speed and the direction they come from, read from the delay of their passage at the four surrounding points. The tooltip gives them ("~45 km/h from W"), and a front of at least 50 km/h is named "fast" on the chart, at the edge and in the tooltip.
- Fronts: surface wind surge. When gusts rise by at least 15 km/h at the passage and reach 30 km/h, the front label adds them ("gusts 55") and the tooltip gives the gusts before and after.
- Fronts: abrupt passage. When most of the air change happens within 2 hours, the tooltip gives the temperature change over those 2 hours.
- Fronts: with a model that Windy only provides every 3 hours, the passage at the ground is given between two hours ("13:00–16:00") instead of an interpolated hour, and a bar joins these two hours at the foot of the line.
- Dust devils: a funnel at ground level signals the hours that bring together their ingredients (strong, deep thermals, light surface wind, dry air and ground, full sun). It is a potential: no observations can check these thresholds.
- Virga: three red chevrons, instead of two orange ones, when the very dry air under the cloud can produce strong downdraft gusts.
- Nearby storm: when the model forecasts a storm 55 km away that the wind pushes towards the place, with none over the place at these hours, a banner says so above the tabs (distance, side, time, speed, possible arrival time), and its icon in a dashed circle is placed on the chart at the hour it may arrive.
- The plugin's altitude and that of the Windy map are synchronised, like the time and the model. Clicking or tapping the "Wind & thermals" chart at an altitude sets the map to the nearest level (surface, 100 m, pressure levels). The map level is marked on the chart by orange dashes and a triangle on the altitude axis.
- The plugin's place follows the picker of the Windy map (the point you move to read the wind): opening or moving it loads the forecast for its position. While it is open, the picker is what shows the place, without the plugin's marker as well; a click elsewhere on the map brings it there. The plugin's place is thus always the one highlighted on the map.
- Time bar at the top of the "Wind & thermals" chart, aligned with its columns: the orange button carries the chosen hour, at the top of the orange line. It is moved by finger or mouse, hour by hour, and the day plays hour by hour with the ▶ button. The chosen hour is no longer repeated on the hour axis, at the foot of the line.
Changed
- Time selection of the sounding: the slider fits on a single line, on phones too. The chosen time is written above its button, in place of the reference hours it covers; the arrows and the play button are at its ends.
- "Sky" strip: one cell per hour replaces the disc. Cloud cover is written in it as a percentage, and the cell goes from transparent (clear sky) to grey (overcast), by day and by night alike. The share that hides the sun and the share that only veils it are no longer told apart there.
- "Wind & thermals" chart: a mouse click chooses the hour and the altitude and no longer opens the sounding, which remains one tab away.
- Scrollbars of the list of days, the chart and the sounding: thin and trackless, the same everywhere. Below the sounding, the light bar looked like a second time slider.
- "Therm." strip: the thermals of green cells are called "well-formed", no longer "easy", in the tooltip and in the legend. The legend names the strip "thermal quality", instead of "how easy thermals are to work". Colours and thresholds do not change.
Version 1.7.03 October 2026
This version changes the displayed top of thermal cumulus: it is lower than before when the air is dry or barely unstable. Their base, the ceilings, the climb rates and the storm risk do not change. It also moves the time of cold fronts, now given at the ground and no longer aloft (often a few hours earlier), and tightens the veil of layered clouds where the air is dry between two model levels: the base and top of cloud layers change accordingly. The layer that frontal rain falls from is now the cloud ceiling of the hour, measured where cloud cover exceeds 40%: its base, given by the tooltip, is often lower than before, and steadier from one hour to the next.
The top of small cumulus drops further: a cumulus whose base is close to the ground dilutes faster than a tower (200 m lower in the median on the test forecasts, no change when the base is 2,000 m or more above the ground). At sites above 500 m of elevation, clouds less than 2,500 m above the ground hide the sun more than before: under an overcast sky around 3,000 m, climb rates are weaker and ceilings lower there. The "Therm." strip turns orange when the wind changes a lot between the ground and the ceiling (wind shear) and, in the mountains, yellow when the ceiling stays below the ridges. CAPE cells change colour at lower values; the values themselves, LI and the storm risk do not change.
Rain is more often drawn as showers, especially with ECMWF, which does not provide convective precipitation: hours drawn so far as frontal rain now carry a shower cloud, with its base and top, and virga when its base is high. With a model that provides its convective precipitation, rain in which it accounts for less than half remains frontal rain.
The freezing level changes when it freezes at the ground under milder air (inversion): it is given at the top of the mild layer, no longer at ground elevation. In the "Therm." strip, an hour with rain or storm risk is no longer green.
Added
- The plugin's time and that of the Windy map stay synchronised both ways. Moving the map's time shows that day and hour in the plugin; choosing a day or an hour in the plugin (day tabs, slider and playback of the sounding, click on the chart) moves the map. On opening, the plugin goes to the map's time.
- Chart: the chosen hour is marked by an orange line, with its hour on the axis. If it is outside the part shown, the chart scrolls to it.
- "Wind & thermals" chart: front passages are drawn on it, as on a weather cross-section. A blue line with triangles marks a cold front, a red line with semicircles a warm front, with its label at the foot. The line follows the frontal surface: it starts from the ground at the hour when the front passes there and leans towards the hour when it passes aloft, a few hours later for a cold front, earlier for a warm front. The tooltip of the hours it crosses gives the cooling or warming of the air aloft, the wind shift, the rain around the passage and the hours of the passage at the ground and aloft. A cold front that passed within the 12 hours before the chart, or a front expected within the 6 hours after it, is announced at the edge with its hour. The legend explains them.
- List of days: the front symbol (blue triangles, red semicircles, or both in purple for an occluded front) follows the name of each day a front passes.
- Fronts: the time of a front is when it passes at the ground, when the air changes fastest near the ground. A cold front often passes there a few hours before reaching altitude, a warm front after. The line passes through the hour at the ground, the hour the map gives at its altitude (about 1,500 m) and the hour when the air changes higher up: it never leans the wrong way, nor by more than 6 hours. The tooltip also gives the pressure change after the passage, when the model provides it.
- Slow fronts: a change of air mass spread over 12 hours is recognised too, cold front and warm front alike.
- Occluded fronts: a purple line with triangles and semicircles marks a tongue of warm air passing aloft under rain, while the air near the ground does not change.
- Dry cold front: a cold front that passes with less than 1 mm of rain is named "dry cold front".
- "Wind & thermals" chart: the cloud ceiling of each hour is drawn on it as a sheet. It is the lowest layer where the model forecasts at least 50% cloud, at any altitude, underlined by a dark line at its base. A low cloud layer (stratus, base less than 2,000 m above the ground, fog when it touches it) is drawn up to its top, underlined in white when the air is clear and dry just above: it is a sea of clouds. A thick layer, or a high-level one, fades upwards. The tooltip gives the base and top, accurate to a few hundred metres, because the model has only a few levels.
- "Wind & thermals" chart: a layer made of clumps separated by gaps has a lumpy top, a continuous sheet a smooth top. Drawn in clumps are the low cloud layer fed by thermals (cumulus, stratocumulus), named "Cumulus layer" in the tooltip, and the thin mid-level layer, more than 2,000 m above the ground, named "Altocumulus" and drawn as a thin band. A thick mid-level layer is named "Altostratus, altocumulus". Under a cumulus layer, the observers of 62 stations in Europe report cumulus 8 times out of 10; under a low cloud layer without thermals, 4 times out of 10. The legend explains it.
- "Wind & thermals" chart: a "Sky" strip, above the chart, shows the sky of each hour. A disc, yellow by day and dark blue at night, is covered in grey over the share of the sky taken by clouds, at all levels, including higher than the chart. The grey is solid for the share that hides the sun, light for the share that only veils it, like a high-level veil.
- "Wind & thermals" chart: the surface wind of each hour is written in the brown terrain, under the ground line, in the colours of the wind aloft. The mean wind (arrow and km/h) is marked "Wind" on the axis, the gusts, below it, "Gust". When the terrain is too thin for them (site close to sea level, high max altitude), the bottom of the chart goes slightly below ground elevation to make room for them. Mean wind and gusts were so far only in the tooltip.
- "Wind & thermals" chart: in the mountains, dashes mark terrain in cloud. They cover the altitudes where the air is saturated, from the ground to the level of the nearby ridges, even where the model forecasts no layer. This level, the highest terrain within 10 km, is marked by a brown dotted line and a triangle on the axis; it is also given below the chart. In flat country nothing is drawn, nor inside a cloud sheet, which already says the terrain there is in cloud.
- Snow line: a pale dotted line traces it at hours with precipitation, and the tooltip gives it. Above it, snowflakes do not melt. In dry air it is well below the freezing level.
- Virga: orange chevrons under a shower whose base is more than 1,500 m above the ground. Rain evaporates as it falls through dry air and cools it: the air comes down in gusts, even with no rain at the ground.
- Mountain waves: in the mountains, a wave at the top of the column signals the hours when the wind reaches 30 km/h at the level of the nearby ridges in stable air, without turning with height. Waves and their rotors are then possible downwind of the terrain.
- Reading by touch: on the chart and on the sounding, hold your finger down for a moment then slide. The tooltip follows your finger, hour by hour and altitude by altitude, without the page scrolling. A slide without holding scrolls as before, a simple tap reads one point.
- Model levels: dots on the altitude axis of the chart, and on the temperature curve and the dew point of the sounding, mark the levels where the model provides its data. Between two dots, wind, temperature and cloud are interpolated: a ceiling that falls between two distant dots is less certain.
- Sounding: a strip, to the left of the wind column, shows the model's clouds at each altitude, like the grey veil of the chart, with a line at the base of the hour's cloud ceiling. The tooltip gives the cloud cover at the pointed altitude.
- Sounding: "Sunrise curve" option, at the bottom of the page. The temperature curve of the sunrise hour is drawn as a pale line under that of the hour shown: the gap between the two shows what the day has changed. The tooltip also gives the temperature of that hour.
- "Therm." strip: in the mountains, a ceiling that does not reach the level of the nearby ridges is flagged in yellow, "below the ridges", even if it is more than 300 m above the model ground.
- Choppy thermals: wind shear counts too. More than 20 km/h of difference between the surface wind and the wind at the ceiling (very choppy beyond 35 km/h), in strength as in direction, signals thermals that are laid over and broken up even when the mean wind of the layer stays moderate.
- Tooltip: "Drizzle" for light rain falling from a low cloud layer, "Spreading cumulus" when the model has at least 60% cloud in the cumulus layer, and the note "3 h total, spread" when the rain of the hour comes from a 3-hour step of the model.
- Panel left open: the current-time line and the storm alert follow the time, re-read every minute, and a forecast displayed for more than an hour is reloaded in place.
Changed
- Showers: post-frontal showers, behind a cold front, are recognised. With almost no energy (CAPE), they were taken for frontal rain. They are now read from cold air aloft above moist air. Compared with the weather reported by the observers of 62 stations in Europe, the plugin draws as showers 5 to 7 shower hours out of 10, against 3 out of 10 before with ECMWF, and 7 hours out of 10 drawn as showers really are shower hours. With a model that provides its convective precipitation, frontal rain in which it accounts for less than half remains frontal rain.
- "Therm." strip: an hour with at least 0.5 mm of rain, or one carrying a storm risk (overdevelopment included), is no longer green. When its thermals would be called easy, its cell is grey, "rain or storm". The legend explains it.
- Freezing level: when it freezes at the ground under milder air (winter inversion in a valley), it is given where the air drops back below 0 °C above the mild layer, instead of ground elevation.
- Sounding: between two full hours, the rain keeps the kind of the current hour (showers or not), the severe storm counts the gusts of the neighbouring hours as it does on full hours, and the cloud ceiling line is the one of the chart, decided with the hours of the day. They no longer change when the slider passes between two hours that share them.
- Fronts: they are read on the map around the place. Besides the forecast of the place, the plugin loads that of four points 55 km to the north, south, east and west: a front is a zone where the air mass (temperature and humidity together) changes quickly from one place to the next, and that the wind pushes over the place. Until now, the front was looked for on the place alone, where the air cools or warms by at least 3 °C in 6 hours between 1,500 and 3,000 m under rain, an overcast sky or a shifting wind: over a month of forecasts for 16 sites in Europe, only 3 map fronts out of 10 were recognised, and almost no warm fronts. Fronts appear a moment after the chart, the time it takes to read the surrounding points. If these points do not answer, the front is looked for on the place alone, from the change of its air mass between 750 and 2,000 m above the ground.
- Wind aloft: the rows of arrows are closer together, to read the wind at more altitudes. With the automatic max altitude, there is one every 200 m instead of 250 m; when the chart goes higher, every 250 to 400 m instead of 500 m, and every 500 m instead of 1,000 m with a max altitude of 8,000 m.
- Frontal rain: the cloud layer it falls from is drawn as a grey sheet, continuous from one hour to the next, with its rain curtain below, instead of one grey tower per hour. Towers are kept for clouds that billow up: thermal cumulus and shower clouds.
- Shower clouds: those of consecutive hours no longer make a row of towers but a single mass, from the base to the top of each.
- Cumulus and shower clouds: new outline, with a flat base, billowing sides and a cauliflower top.
- Clouds higher than the chart: a light glow comes down from its top edge, in place of the light band.
- Layered clouds: between two model levels, the veil stops where the air dries out, instead of fading out halfway. Under an inversion, the top of a sea of clouds is thus placed lower, closer to the saturated level. Rain layers and low cloud layers follow the same rule.
- Model that does not provide cloud cover by level: it is estimated from humidity, instead of an empty sky. The tooltip says so.
- The selected day is no longer remembered from one opening of Windy to the next: the map's time decides which day is shown.
- Thermal cumulus: their width tells their amount. Narrow when the model forecasts little cloud in their layer, they widen until they fill the column when they spread out.
- Thermal cumulus: the top of a small cumulus, whose base is close to the ground, is lower than before. A small cloud mixes with the dry air around it faster than a tower.
- Share of the sky that hides the sun: cloud levels are counted from the ground, no longer at fixed altitudes. At a high-elevation site, a cloud 1,000 or 1,500 m above the ground counts as a low cloud, which hides all the sun, instead of a mid-level cloud. Thermals are weaker there under these clouds. Below 500 m of elevation, nothing changes.
- CAPE: the colour levels move to 200, 650 and 1,600 J/kg, instead of 300, 1,000 and 2,500. The CAPE shown stops at the highest level provided by the model (often 400 hPa) and is about two thirds of a full CAPE: the old levels left it green for too long.
- Sounding: near the ground, the superheated air is drawn in the lowest 100 m, then the temperature curve follows the dry adiabat up to the first model level. It no longer shows absolute instability over the 300 to 500 m between the ground and that level. The computed values (ceiling, thermal top, CAPE) do not change.
- Sounding: the tooltip no longer overflows the frame when it has many lines.
Fixed
- Thermal cumulus: small cumulus are no longer drawn as a tower rising to the top of the chart, often up to a high-level veil, when the air is barely unstable. Their top now takes into account the air the cloud mixes in as it rises: dry air stops it quickly, moist unstable air lets it climb. Chart, tooltip and sounding give this top. The storm risk is still judged on the height the cloud can reach without diluting.
- Chart: the current-time line is only drawn on the day itself. With "Show 24 h", it appeared shortly before midnight at the left edge of the next day's chart.
- Sounding: automatic playback stops when the day or the place changes. After an earlier day was chosen, it kept going and stayed stuck at the end of the day.
- Update: "Link copied" is only displayed if the link was actually copied.
Removed
- "Bulletin" tab: the written weather bulletin of the day no longer exists. Front passages are still drawn on the "Wind & thermals" chart, and the day's storm alert remains above the tabs.
- "Cross-country" tab: the map of the best cross-country take-offs is removed for now. The data it kept in the browser is erased when the plugin opens.
Version 1.6.21 October 2026
Changed
- Sounding: the values of the hour (ceiling, thermal top, vario, 0 °C, cumulus, ground temperatures, CAPE, LI, storm risk) are now below the chart, which comes right after the time slider. On phones, they fit on five lines instead of eight, two values per line.
Version 1.6.11 October 2026
Fixed
- Tabs on phones: the names (Wind, Sounding, XC, Bulletin) are displayed in full, under their icon. On a narrow screen they were cut off ("Soundi…", "Bul…").
Version 1.6.01 October 2026
The bulletin no longer grades conditions: it describes the forecast weather, in a single text. The values it quotes (clouds, rain, fronts, wind, thermals, temperatures) do not change, nor do those of the other tabs; the wind direction is now given in full words, on eight directions ("south-west").
Changed
- Bulletin: it is now a weather bulletin written in one piece, geared to free flight. The text describes the sky and precipitation of the day, any fronts and storm, the wind at the ground and at two altitudes with its gusts, then the thermals (hours, vario climb, ceiling), the cumulus, the temperatures and the freezing level. The tab now shows only this text.
- Bulletin legend: it explains how the sky, precipitation, wind, thermals and fronts are described, and recalls the limits of the model.
Removed
- Bulletin: the level of conditions (calm, moderate, strong, adverse), the hour-by-hour colour strip, the time slots and the assessment of the day. The bulletin no longer assesses flying conditions.
- Bulletin: the summary box, the sections and the preview of the following days. The bulletin of another day opens from its tab, at the top of the panel.
Version 1.5.01 October 2026
The ceilings and climb rates shown do not change. The clouds drawn, however, may change: an hour of rain may switch from shower to frontal rain (or the reverse) depending on the hours around it, and cumulus are no longer shown at hours without usable thermals.
Added
- "Wind & thermals" chart: rain from layered clouds (frontal rain) is drawn. At each hour of rain without a shower cloud, a grey tower shows the cloud layer it falls from, from base to top, with its rain curtain; the tooltip gives its altitudes ("Rain cloud layer"). Before, the rain bar had no cloud above it.
Changed
- "Wind & thermals" chart: layered clouds are a plain grey veil, without streaks. With the changes in cloud cover from one hour to the next, the streaks drew a grid on the background. Cumulus towers still stand out by their dark outline.
- Under a shower cloud, rain is a curtain of three rows of strokes fading downwards, easier to read behind the wind arrows.
- The kind of rain (showers or frontal rain) is decided over five hours, the hour and the two on each side, no longer hour by hour. Energy that barely crosses the threshold for one hour no longer draws an isolated shower cloud in the middle of continuous rain, and an hour just under the threshold among showers keeps its cloud. The bulletin (kind of rain episodes, fronts) follows the same rule.
Fixed
- Thermal cumulus are no longer shown at hours without usable thermals (chart, tooltip, bulletin). Under an overcast, rainy sky, a tall white tower could rise to the top of the chart while the day's tab said "No thermals". The sounding still shows the parcel ascent.
Version 1.4.11 October 2026
The bulletin's time slots are stricter than in 1.4.0: they may be shorter, or disappear, and the assessment of the day may change with them. The other values shown do not change.
Fixed
- Bulletin: the time slots now match the coloured cells of the hour strip. A "calm conditions" slot no longer covers an hour shown as moderate conditions (nor a "calm to moderate" slot an hour of strong conditions): a single hour one level higher cuts it. The assessment of the day, which counts these slots, may change.
- Bulletin: the hours below the strip are placed at the start of their cell, no longer in the middle. A slot "from 08:00 to 13:00" reads as such on the strip.
- Bulletin: "calm to moderate" is preceded by the two colours the slot combines, and "no slot of at least 2 h" replaces "no slot" when isolated hours have this level.
Version 1.4.01 October 2026
The ceilings and climb rates shown do not change. The storm risk, however, may be higher than in 1.3.0 in the evening and at night: the model's storms are now judged on the most unstable air, and a likely thunderstorm becomes "severe thunderstorm possible" when the air lends itself to it.
Added
- "Bulletin" tab: the day's flying bulletin, written from the forecast of the chosen model. It gives an assessment of the day, the strength of conditions at each daylight hour (calm, moderate, strong, adverse), the time slots that follow from them and that of usable thermals, the wind at the ground and aloft, the thermals, then a preview of the following days, which can be clicked. It describes conditions, not a pilot's fitness to fly; the tab's legend details the criteria.
- Bulletin: sky and precipitation. State of the sky in the morning and in the afternoon with the cloud levels and the altitude of the lowest ones, possible mist or fog early in the morning, thermal cumulus (hours, base, tops, depth), precipitation episode by episode (kind, intensity, total, wettest hour), snow line, wet ground at sunrise, ground temperatures and freezing level.
- Bulletin: front passages. A cold or warm front is reported with its time, the cooling or warming aloft, the wind shift, the rain and the gusts that come with it; a front that passed the day before or is expected the following night is mentioned too.
- "Severe thunderstorm possible" level (purple icon with two lightning bolts): a likely thunderstorm in very unstable air (LI ≤ −6), or in unstable air with strong winds aloft that organise the storm (√(2 · CAPE) × surface–6 km shear), or with model gusts of at least 70 km/h.
- Alert banner above the tabs on storm days: arrival time, cause, speed and direction of motion, forecast gusts, and whether it arrives without warning signs or under an already overcast sky. It also flags mere overdevelopment when the air is primed for severe storms.
- "Wind & thermals" chart: "CAPE LI" strip below the rain. Each hour has its cell, CAPE on the left and LI on the right, each on the colour of its level (green, yellow, orange, red): the rise of instability during the day is read at a glance, without hovering over the columns.
- Sounding: coloured dot for the level of CAPE and LI (also in the chart tooltip), CAPE of the most unstable air ("max") when it is well above the standard CAPE, and storm expected within the 3 hours after the hour shown.
- Sounding: the tooltip gives the estimated vario climb at the pointed altitude, with its colour, as on the "Wind & thermals" chart.
- Sounding: "Parcel ascent" option, at the bottom of the page. It draws the path of the thermal from the ground to where it stops (thermal top, or cumulus top) and its dew point in blue dashes, which meets it at the condensation level, marked with a dot even when the thermal stops below it. Above this level, the path switches from yellow (dry adiabat) to yellow and blue (moist adiabat). The areas where the thermal is warmer than the air are tinted. The choice is remembered.
Changed
- Sounding: the cloud formation zone is drawn. Between the base and the top of the thermal cumulus, a light layer with a flat base and a billowing top replaces the barely visible veil; it is explained in the legend.
- Storms that the model develops by itself are judged on the most unstable air of the lowest 300 hPa, no longer only on the air near the ground: a storm arriving in the evening or at night over air that has stabilised at the ground is no longer missed.
- Tooltip of the "Wind & thermals" chart arranged by theme (wind, thermals, temperature, clouds and precipitation, storm): in each group, the value at the pointed altitude comes before those of the column, for example the vario at that altitude then the max vario.
- Max altitude: 7,000 and 8,000 m can also be chosen. Above the highest level provided by the model (around 7,500 m), the chart and the sounding are hatched: the model gives no wind, temperature or clouds there.
- Light theme: the "Wind & thermals" chart keeps the colours of the dark theme (sky, wind arrows and figures with a dark outline, ceiling in white), easier to read than their light version. Only the axes and the "Therm." and "Rain" strips take the colours of the light theme.
Removed
- Mean wind of the thermal layer, in the chart tooltip and above the sounding. Thermals broken up by the wind are still flagged in the "Therm." strip, in the tooltip and, above the sounding, next to the vario.
- "Wind & thermals" chart: the hour shown in the sounding is no longer framed in yellow on it. Tapping or clicking an hour still chooses it for the sounding.
Version 1.3.01 October 2026
The thermal calculations have been revised: in the same conditions, the ceilings shown are markedly lower than in 1.2.7 (by 300 to 450 m in fair weather on the test forecasts), and climb values are now vario climbs.
Added
- "Therm." strip below the chart: how easy the thermals are to work, hour by hour (easy, weak or low ceiling, choppy, very choppy), also given in the tooltip.
- Storm risk: "overdevelopment possible" and "thunderstorm likely" icons on the chart, the day tabs and the sounding, estimated from the thermal cumulus and from the storms forecast by the model itself, at any hour.
- Standard CAPE and LI in the tooltip and the sounding, explained in the legend.
- Shower clouds: a grey tower with rain strokes at hours of convective rain, even without thermals (night, overcast).
- Snow told apart from rain in the precipitation (bars and tooltip).
- Band at the top of the chart for clouds above the altitude shown; the levels where the model gives only cloud cover are taken into account.
- Sounding: a slider sets the time in 5-minute steps, and the forecast is recomputed for the chosen minute.
- The plugin's model and that of the Windy map stay synchronised both ways.
- Up to 15 days of forecast with Windy Premium and 7 days without (5 before).
- Automated tests of the calculations (
npm test) on two real ECMWF forecasts.
Changed
- Thermals: the parcel starts from the mixed air of the lowest 500 m, with a superheat that depends on the heat flux instead of a fixed +1 °C; the flux takes into account clear-sky radiation (Haurwitz), clouds, wet ground and air density.
- The climb rates shown are the climb read on the vario (updraft minus the circling sink rate), and the usable ceiling is the altitude where this climb drops to zero, without exceeding the cumulus base.
- Thermals are at full strength from the ground up.
- The rain of each hour is placed under the hour that follows, the one during which it falls.
- Chart background sky blue by day and midnight blue at night; the sunrise and sunset lines fall in the middle of the fade.
- The model's layered clouds are a streaked grey veil, more opaque when the sky is overcast; thermal cumulus are white with a shaded base.
- Best take-offs map: finer grid, colours readable from 15 km, grey veil where no cross-country flight is possible, coloured distance bubbles.
- Light theme: softer outline of the figures.
- Shortened legends.
Fixed
- Beyond the range of a model (ICON-D2, AROME FR…), Windy fills in with another model: these days can no longer be clicked and are shown as "Out of range".
- A ceiling less than 100 m above the ground is no longer drawn: its line covered the ground values.
Removed
- List of the three best take-offs and their tracks on the map: only the flight from the chosen site is drawn.
Version 1.2.730 September 2026
Fixed
- Nothing was displayed any more for accounts without Windy Premium since 1.2.6: interpolated hours are aligned on full hours, and series are matched to within 30 minutes.
- The rain of each 3 h block is spread over the 3 hours that follow.
- If the interpolation fails, the raw data in 3 h blocks is shown rather than an empty screen.
Version 1.2.630 September 2026
Added
- Hour-by-hour forecasts for accounts without Windy Premium: data provided in 3 h steps is interpolated (wind along the shortest path, rain spread out), then the thermals are recomputed for each hour.
Version 1.2.530 September 2026
Added
- Surface gusts in the chart tooltip.
Changed
- More compact tabs on phones.
Fixed
- When the model gave no gust for an hour, the surface wind speed was shown in its place.
Version 1.2.430 September 2026
Added
- The last model chosen is remembered, as well as the selected day as long as it is still the same day.
Changed
- Charts keep their scroll position when the day, hour, tab or place changes.
Version 1.2.330 September 2026
Changed
- Redesigned tabs: full-width bar, one icon per tab, legend button on the right.
Fixed
- Tabs no longer move on click.
Version 1.2.230 September 2026
Added
- Three tabs: Wind & thermals, Sounding, Cross-country.
- Forecast length of each model in the model list.
- "New version" banner: on opening, the plugin checks whether a more recent version is published and offers its install link.
Version 1.2.130 September 2026
Changed
- Texts and comments reworded; no functional change.
Version 1.2.029 September 2026
First public version (the previous ones could only be installed by link).
Added
- Map of the best cross-country take-offs, in free distance or out-and-return, simulated on a grid of the visible area. It replaces the mean climb map.
- English version: the language follows that of Windy.
- Light theme, remembered.
- Sunrise and sunset times on the chart.
Changed
- Plainer model selector, to the left of the place name.
- The chart takes the full width of the panel.
- "Show 24 h" is ticked by default.
- While the take-offs map is displayed, Windy switches to its basic map background, with no weather layer or wind animation, then restores its settings.
- The sounding uses all the levels present in the data.
Version 1.1.629 September 2026
Changed
- The plugin is renamed "PG Soundings" (
windy-plugin-pg-soundings). For Windy it is a new plugin: it must be reinstalled.
Version 1.1.529 September 2026
Changed
- The plugin is renamed "ParaGraphs" (
windy-plugin-paragraphs).
Version 1.1.429 September 2026
Added
- Rainfall below the chart: one bar per hour, in mm.
Changed
- Thermal zone computed at screen resolution, without stair-stepping.
- Large cumulus drawn as towers.
- Sharper mean climb map, in the climb colours of the chart.
Removed
- AROME HD, for which Windy provides no upper-air data; AROME FR replaces it.
Version 1.1.329 September 2026
Added
- Mean climb map (net vario climb, from 11:00 to 17:00), in place of the cross-country potential map.
- AROME FR model.
- Days beyond the model's range stay visible, greyed out, marked "Out of range".
Changed
- Climb colour scale in steps of 0.5 m/s.
- The map grid is fixed and cached for 3 hours: moving the map only reloads the edges.
Version 1.1.229 September 2026
Changed
- The potential map follows the zoom and recomputes by itself; it accepts an area twice as large.
- Potential calculation revised on real forecasts: cirrus veils cost little, the cumulus base is computed with the mean humidity of the mixed layer, no thermals over the sea, only the usable height counts.
- Wider charts: altitude axis title removed, sounding margins reduced.
- On phones, the sounding scrolls horizontally.
Fixed
- False "area too large" message on large screens.
Version 1.1.128 September 2026
Changed
- New model selector, with the resolution and coverage of each model.
- More readable potential map: distinct colour steps and distances written on the map.
- Bottom of the panel: site elevation, model ground elevation, forecast run time.
- Climb colour transitions smoothed between two hours.
Version 1.1.028 September 2026
Added
- Map of the day's cross-country potential, computed on a grid of the visible area.
Changed
- On phones, the chart shows one column per hour and scrolls horizontally, with a fixed altitude axis; the sounding is less squashed.
- Panel layout: model selection under the place name, settings at the bottom of the page.
Version 1.0.028 September 2026
First release, under the name "Parapente" (windy-plugin-parapente).
Added
- Altitude × hour chart: wind by altitude band, thermal zone, ceiling, cumulus base, model clouds, freezing level and terrain.
- Skewed sounding of the chosen hour: temperature curve coloured by stability, dew point, parcel path, wind by altitude.
- Tabs per day, model selection (ECMWF, ICON, GFS, ICON-EU, ICON-D2, AROME, UKV), maximum altitude, daylight hours or 24 h view.
- Hover tooltips and legends on demand.
- Display adapted to phones.